

SUI price has remained under strong bearish pressure since the start of Q4 2026, which has dragged the price from around $1.30 to $0.82. By the end of the month, the price managed to pause the declining trend and is approaching a critical point. After failing to sustain its October recovery, SUI has slipped back towards $0.90, raising questions about whether buyers can regain control and make another attempt at the psychologically important mark at $1.
Can Buyers Defend the $0.84 Support?
The SUI price chart reflects a weakening price structure, with the token gradually losing ground after failing to sustain the local high. Currently, the token is trading around $0.8927, down by 1.10%, bringing the price closer to the crucial horizontal support at $0.8415. This level is pretty important, as it previously acted as a support floor during earlier consolidation periods. A sustained defence of this region could provide buyers with an opportunity to stabilise the price and attempt a recovery towards $0.90.
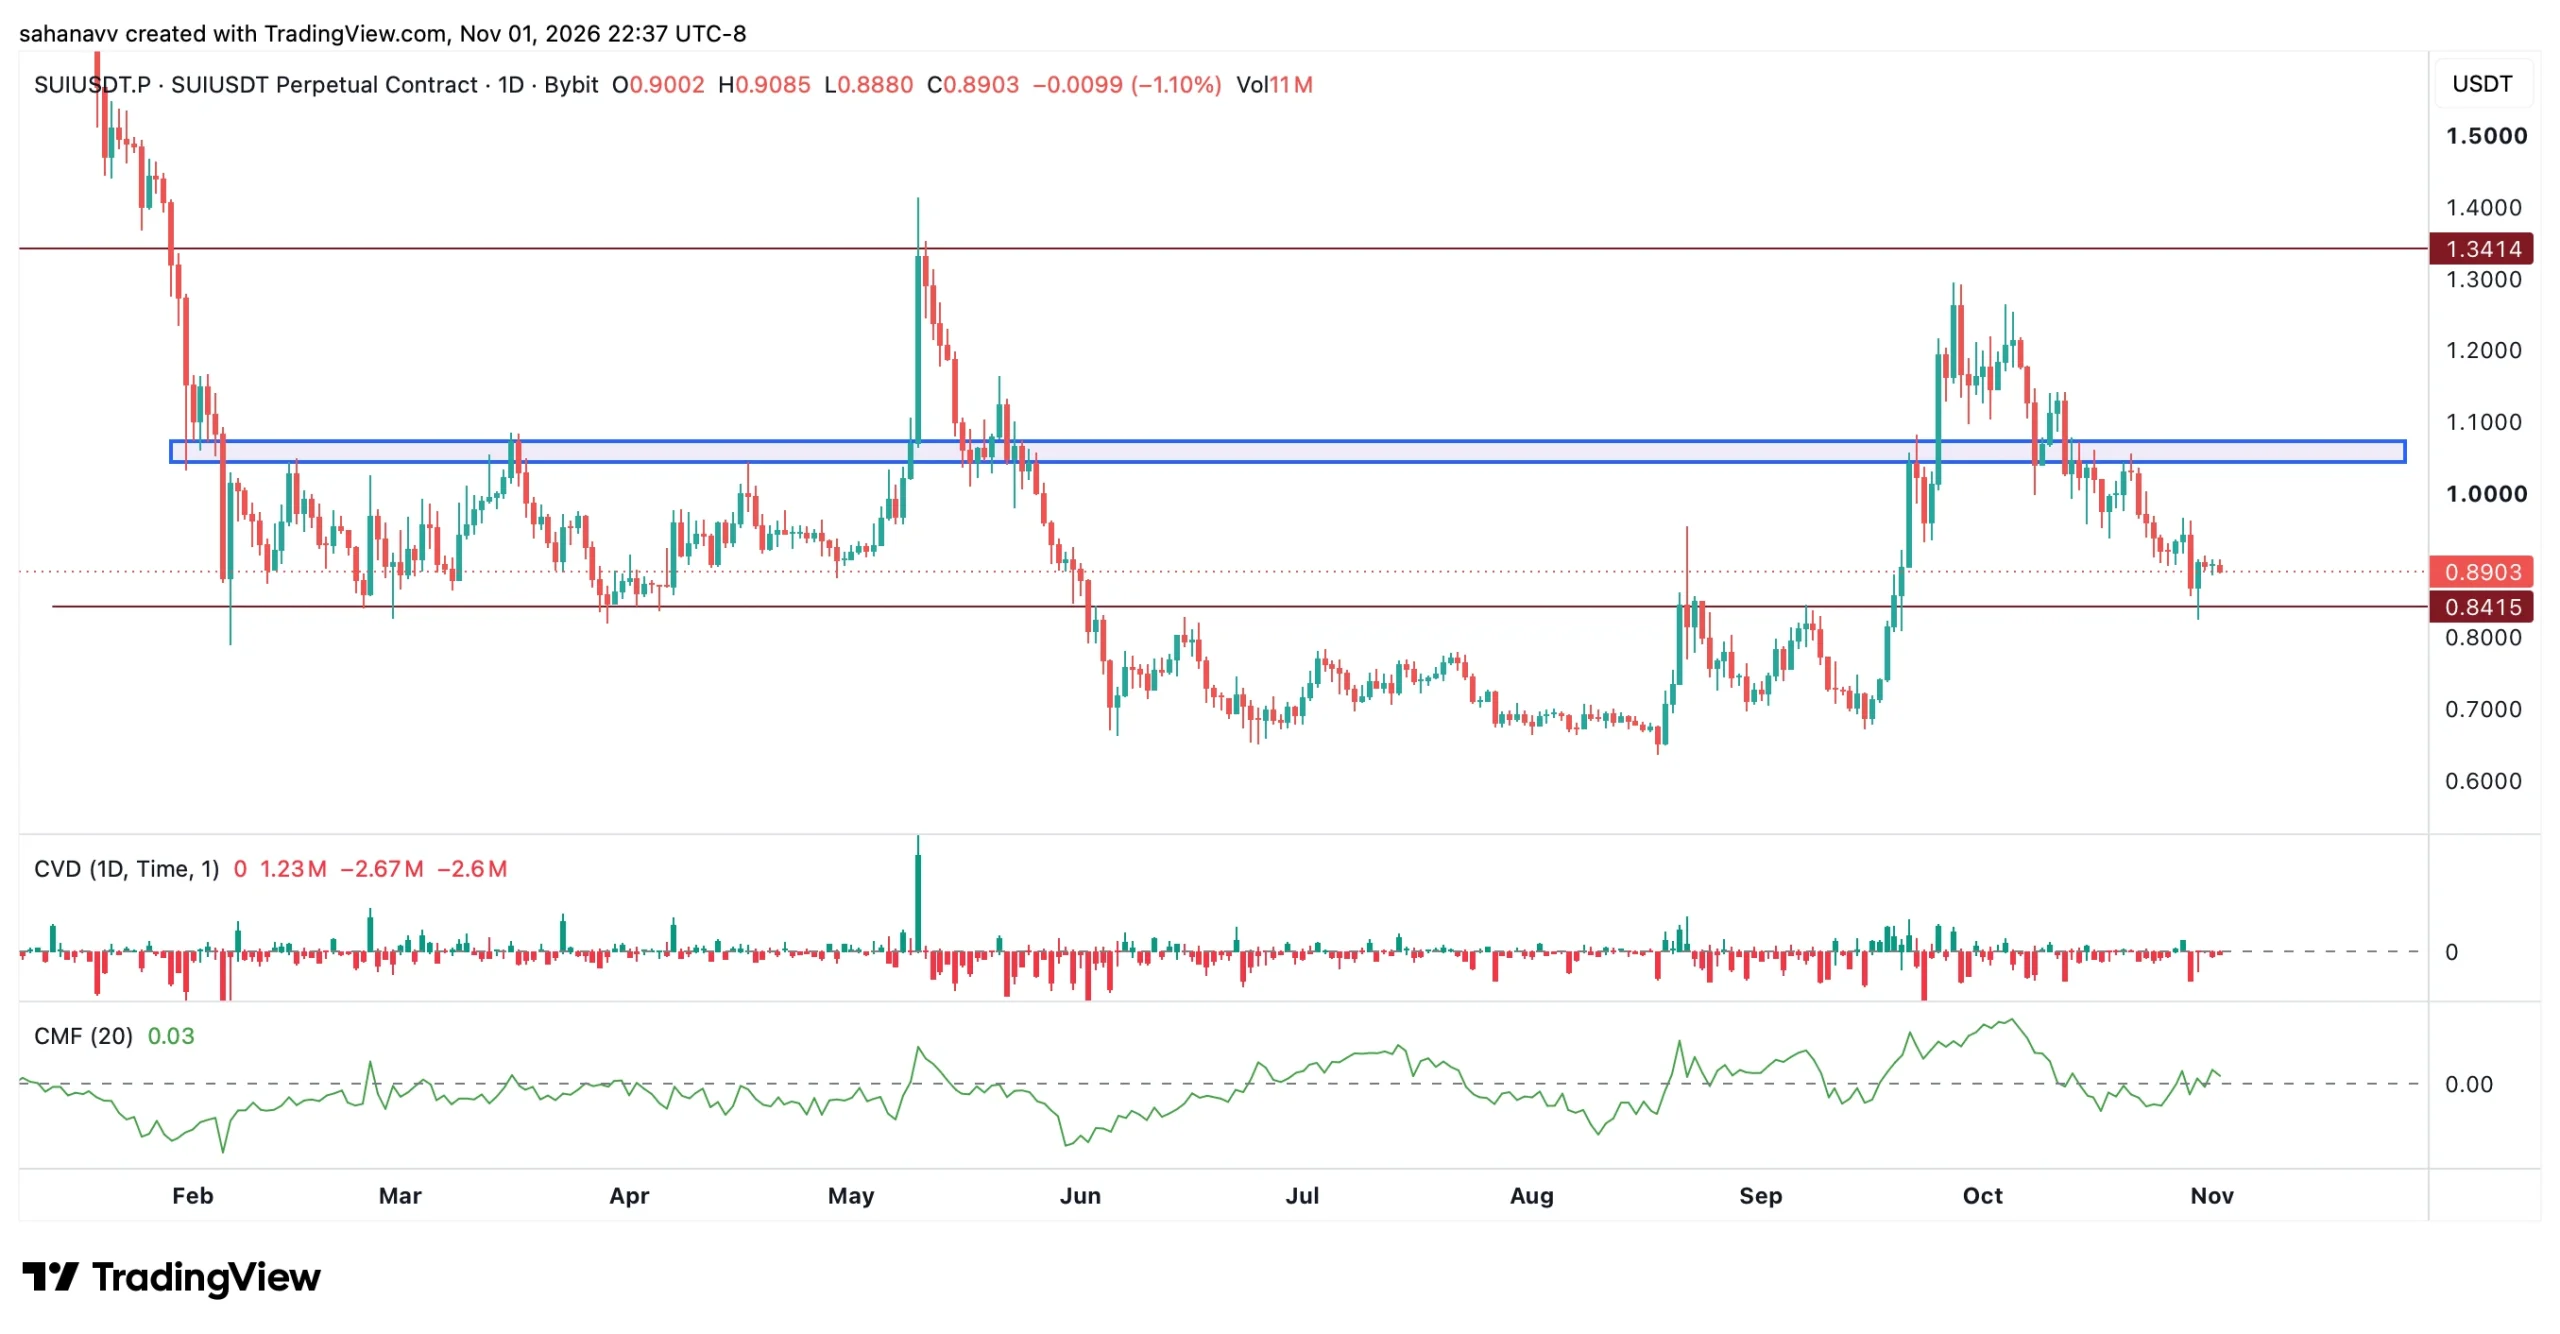
The volume indicators offer a mixed picture. The CVD reading stands at nearly 2.6 million, suggesting that aggressive market selling outweighed buying during the latest session. Meanwhile, the CMF indicator remains marginally positive at 0.03, indicating that buying pressure has not disappeared entirely. This combination does not point to a confirmed reversal but suggests SUI is approaching an important support test as buyers struggle to gain momentum.
A daily close below $0.8415 could expose the token to further downside, while a sustained recovery above $0.90 would indicate improving price action.

SUI Derivative Analysis: Is Selling Pressure Still Dominating?
While the daily chart highlights the growing pressure on SUI’s price, derivatives data offers further insight into how traders are positioning themselves amid the decline. Aggregated open interest has dropped to nearly $255.64 million, down considerably from its October peak of more than $400 million. This decline suggests that traders have been reducing their exposure as price declines.
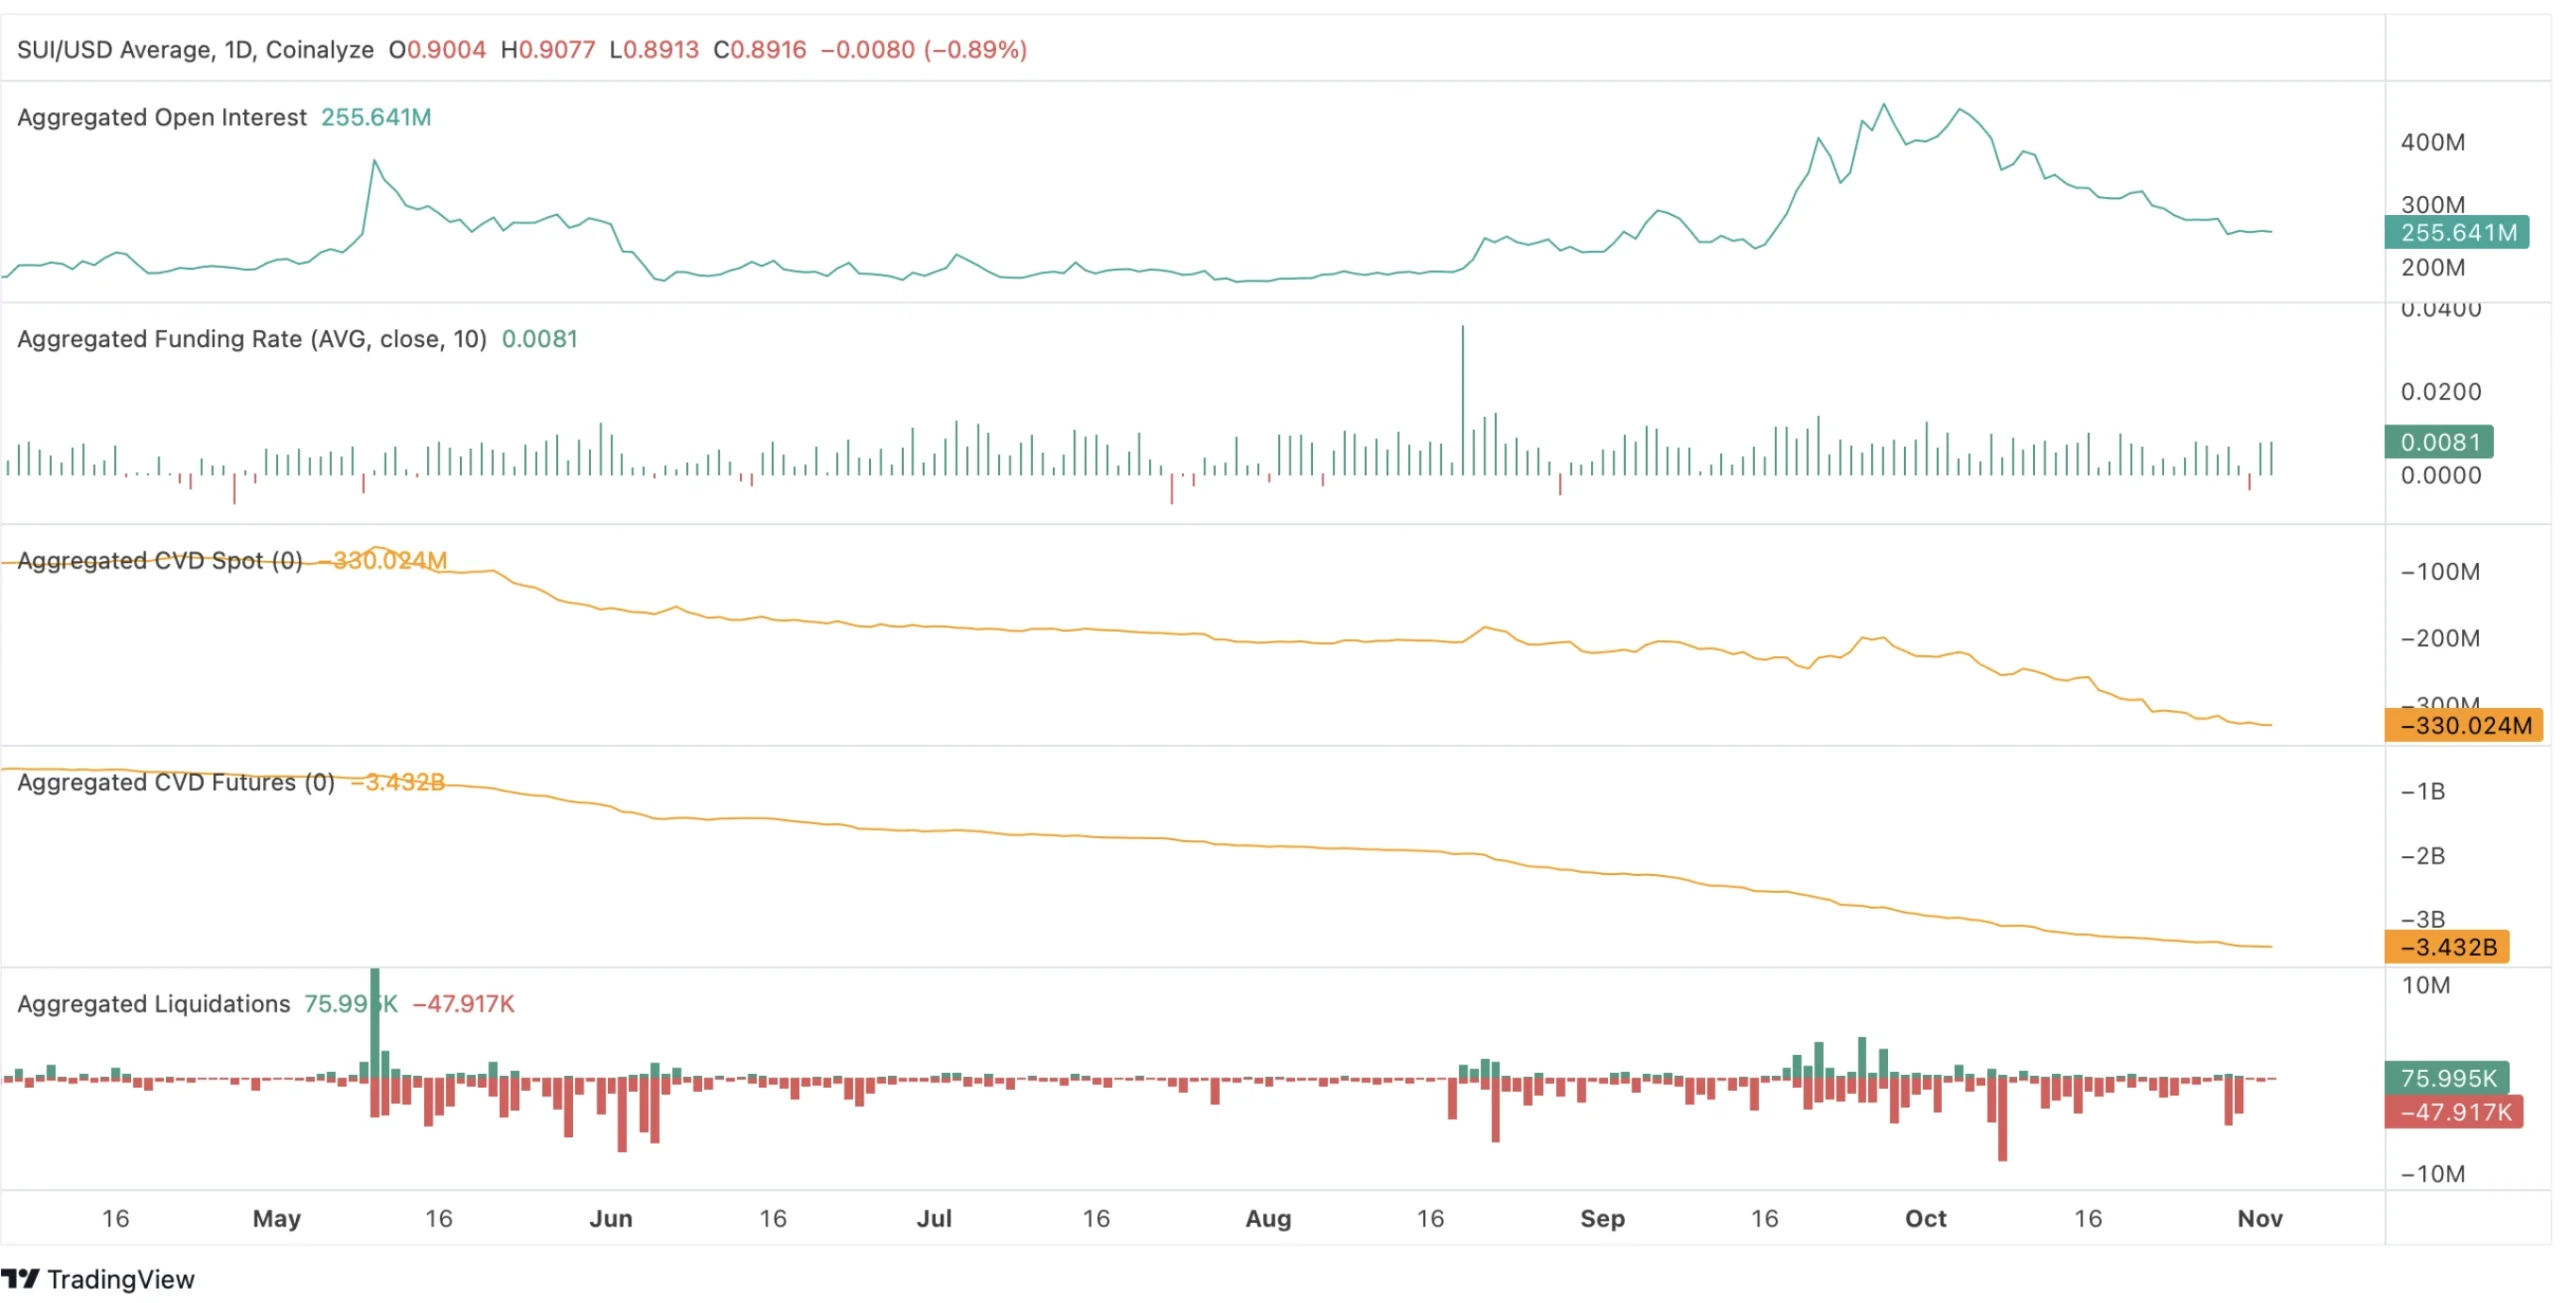
On the other hand, the funding rates remain positive, indicating that long positions are paying shorts and the bullish positioning has not entirely disappeared despite the weakening price structure. Besides, the aggregated spot CVD and futures CVD have both maintained a downward trajectory, suggesting that aggressive selling has continued across spot and futures markets. Demand in the spot market also appears weak, making it harder for SUI to establish a sustainable recovery.
Meanwhile, the liquidation data does not show a capitulation event comparable to the larger spikes recorded earlier in the period. Taken together, the derivatives paint a cautious picture. OI is declining as traders reduce their exposure, but persistent selling across spot and futures markets suggests that buyers have yet to regain control. Unless spot demand begins to improve, SUI could struggle to defend its $0.8415 support and build momentum towards $1.
Key Levels to Monitor
- $0.90: Immediate psychological level and first recovery hurdle
- $0.8415: Major horizontal support, a critical level for buyers to defend
- $0.80: Potential interim downside area if the major support breaks
- $0.70 to $0.68: Previous consolidation region and deeper support
- $1: psychological resistance and an important recovery milestone
- $1.05 to $1.08: major supply zone that buyers need to reclaim
- $1.20 to $1.30: Higher resistance region from the October recovery attempt
Will the SUI Price Rebound to $1 This Month?
The SUI price recovery to $1 will largely depend on whether buyers manage to defend the $0.8415 support and bring fresh demand back into the market. A recovery above $0.90 could provide the first indication of improving momentum, with the $1 mark becoming the next major target. Declining OI suggests that excessive speculative positioning is cooling, potentially allowing the market to establish a more stable base. Therefore, if this is accompanied by improving spot demand and a recovery in CVD, SUI could build the momentum needed to challenge the $1.05 to $1.08 resistance zone.
Was this writing helpful?
Story Ends Here
Trust with CoinPedia:
Investment Disclaimer:
All opinions and insights shared represent the author’s own views on current market conditions. Please do your own research before making investment decisions. Neither the writer nor the publication assumes responsibility for your financial choices.
Sponsored and Advertisements:
Sponsored content and affiliate links may appear on our site. Advertisements are marked clearly, and our editorial content remains entirely independent from our ad partners.
Read the Next News