

The crypto market has been navigating a heightened period of volatility, with the Bitcoin price struggling to maintain its recovery. The situation intensified following the reported $6.3 billion security breach at Binance, which triggered fresh uncertainty across the market. After hitting the lows at $76,460, the BTC price is struggling to rise and sustain above $78,000, as it has yet to establish a convincing bullish reversal. However, the liquidation heatmap flashes a hidden bullish divergence in the form of a short squeeze.
Therefore, it would be interesting to watch whether Bitcoin can attract enough buying pressure to trigger a short squeeze and reclaim $85,000, or whether renewed selling pushes the price below $70,000.
Bitcoin Struggles at $78,000 as Selling Pressure Intensifies
Following its recent recovery from the lows, the BTC price is attempting to stabilise around $78,000. However, the chart suggests that buyers have yet to regain control, with Bitcoin continuing to trade below an important resistance level near $78,943. After forming consistent lower highs and lows, the token is trying to find support at $78,000.
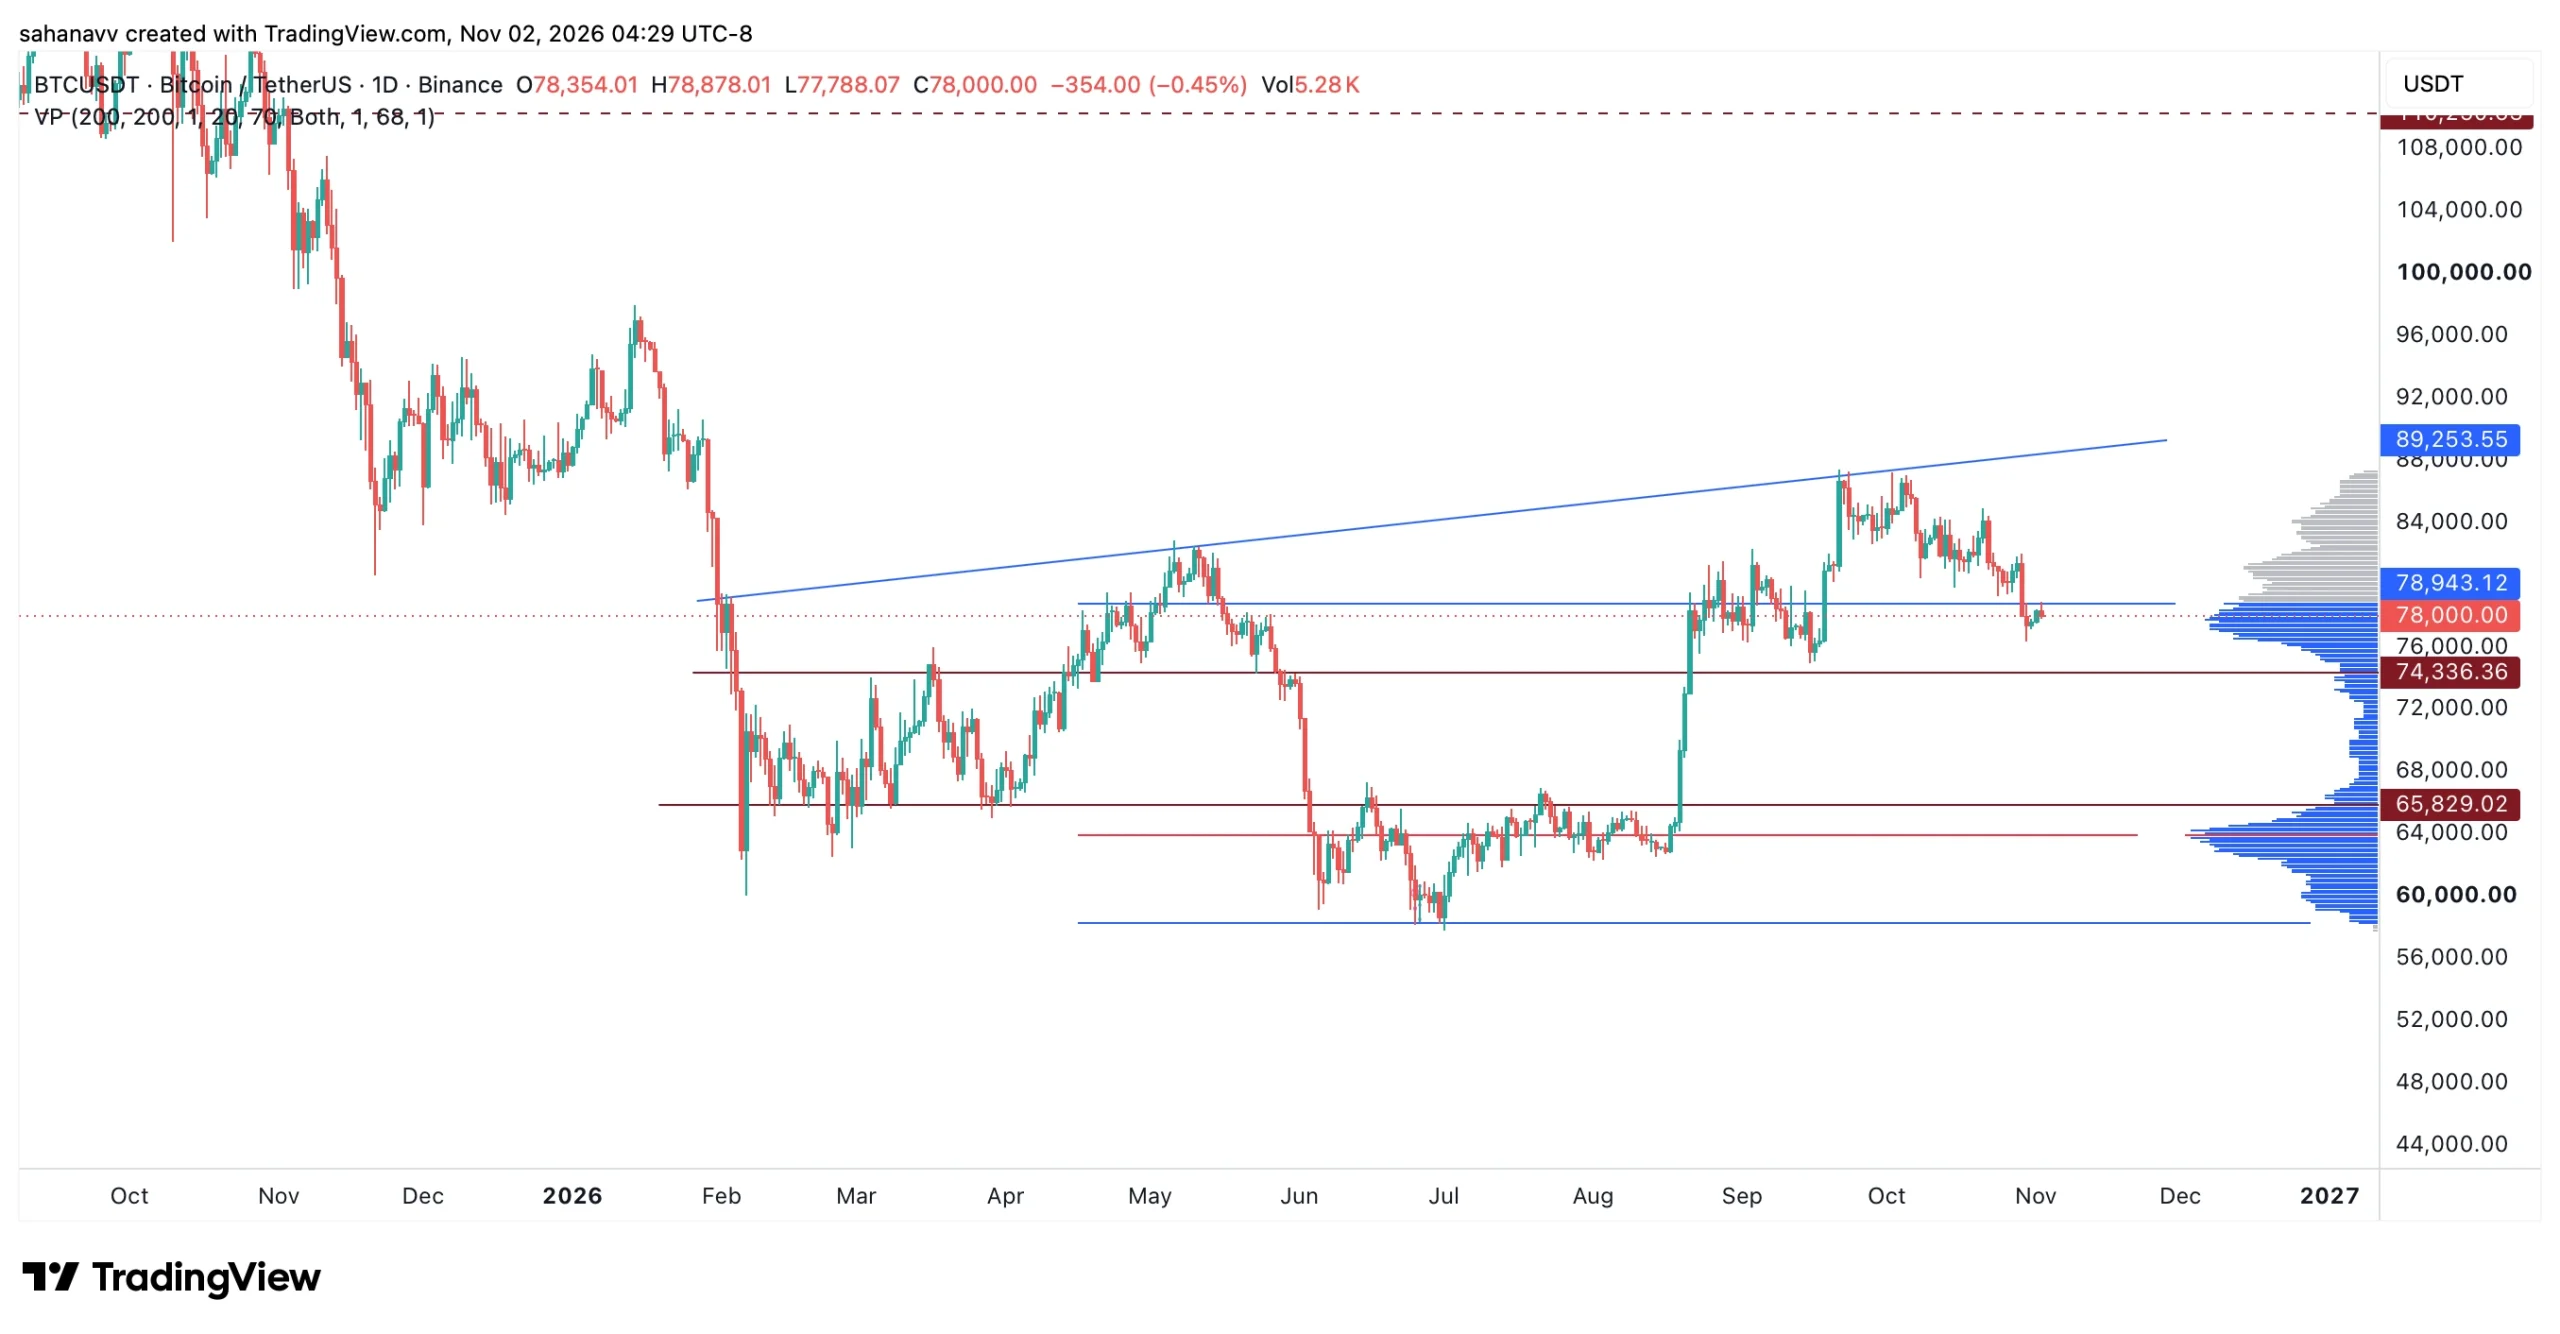
The volume profile highlights a significant concentration of trading activity around the $76,000 to $79,000 region. This makes the current price range particularly important, as it represents an area where considerable market participation has taken place. The crypto is trading within this high-volume region, making its ability to hold above it an important factor in determining the next move.

If buyers manage to defend this zone and reclaim $78,943, the recovery could extend towards $80,000 & above. However, a failure could expose the rally towards the support below $75,000; below this, the $70,000 psychological threshold lies.
BTC Liquidity Map Points to $85,000 as a Key Upside Zone
While the volume profile identifies the areas where Bitcoin has attracted significant trading activity, the liquidation heatmap highlights where leveraged positions could come under pressure. The liquidation heatmap below shows a noticeable imbalance between potential short and long liquidations around the current price.
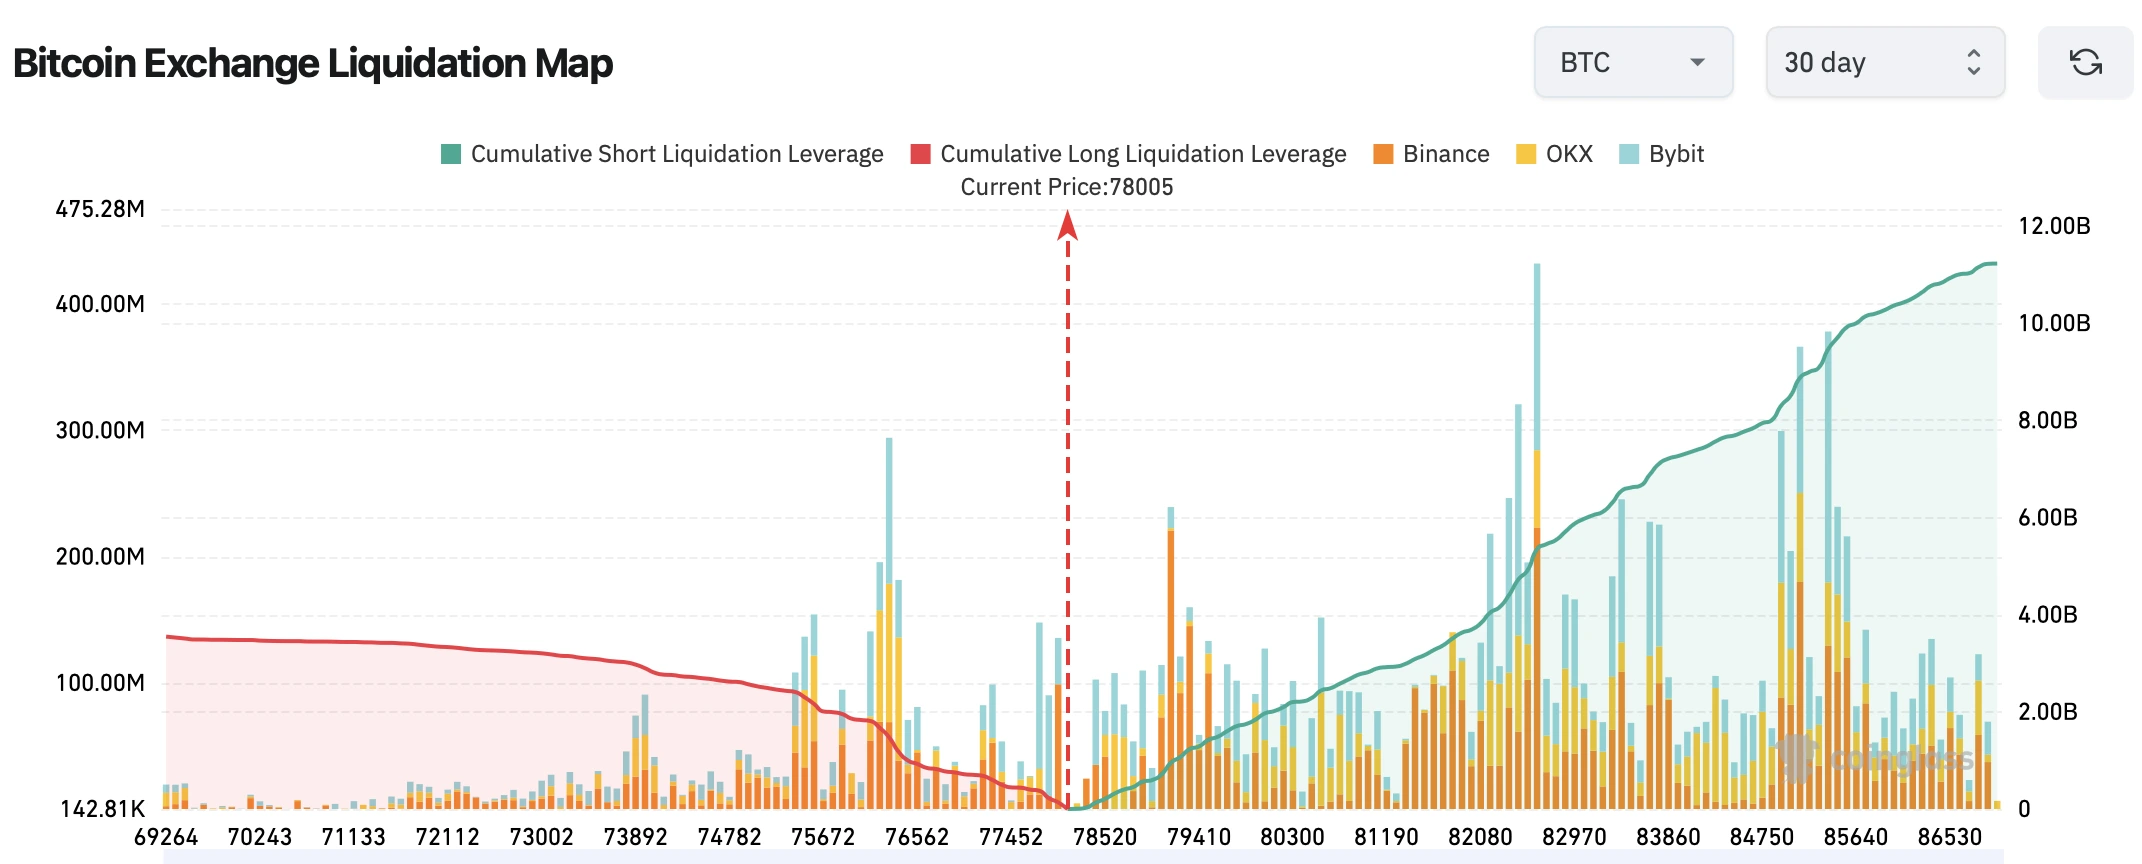
With the BTC price trading near $78,000, the cumulative short liquidation leverage above the current price is considerably larger than the potential long liquidation leverage below it. The map indicates nearly $11 billion in cumulative short liquidation leverage towards the upper end of the displayed range, compared with roughly $3.5 billion in potential long liquidation leverage on the downside.
A sustained recovery could force leveraged short positions to close, potentially adding further buying pressure and accelerating the move towards higher liquidity concentrations, probably at $85,000.
Will Bitcoin Trigger a Short Squeeze to $85,000 or Drop Below $70,000?
Bitcoin’s next move could present an opportunity for bulls to manage to regain control of the region around $79,000 to $80,000. The concentration of short liquidations above the current price creates the possibility of an upside squeeze. Therefore, if buyers reclaim $80,000, the short squeeze towards $85,000 could gather momentum. However, losing $74,336 would shift the advantage towards sellers and put the $70,000 threshold at risk.
Was this writing helpful?
Story Ends Here
Trust with CoinPedia:
Investment Disclaimer:
All opinions and insights shared represent the author’s own views on current market conditions. Please do your own research before making investment decisions. Neither the writer nor the publication assumes responsibility for your financial choices.
Sponsored and Advertisements:
Sponsored content and affiliate links may appear on our site. Advertisements are marked clearly, and our editorial content remains entirely independent from our ad partners.
Read the Next News